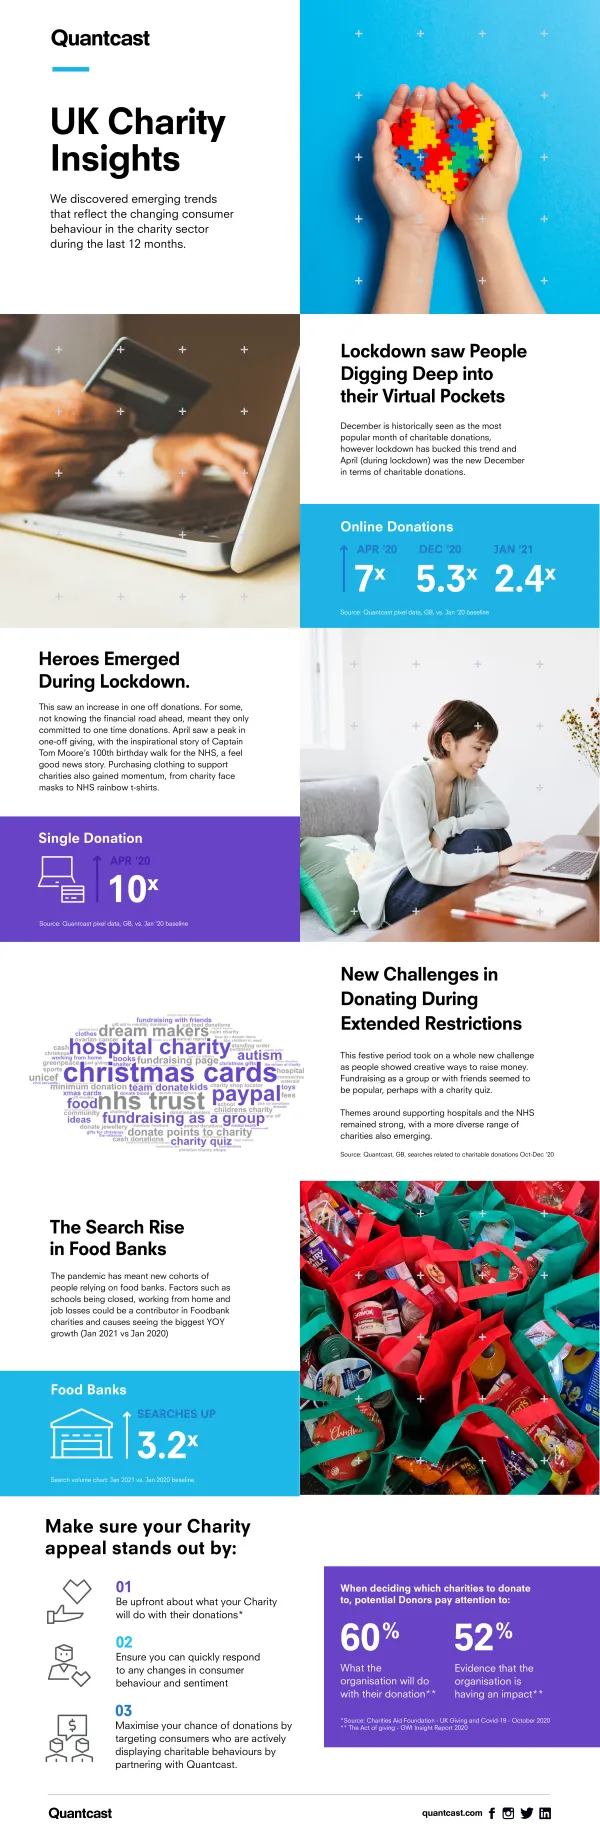
Quantcast Insights
Seasonal and industry-vertical insight reports — visualizing anticipated audience data for clients across the sales cycle. The collaboration was tight: data science generated the underlying numbers, product marketers framed the story, and I shaped the data visualization so the takeaway landed without the reader having to be a data scientist themselves.
Team: Field Marketing, Digital Marketing, Sales
Role: Creative Direction, Print Production
Timeline: 3 months per report
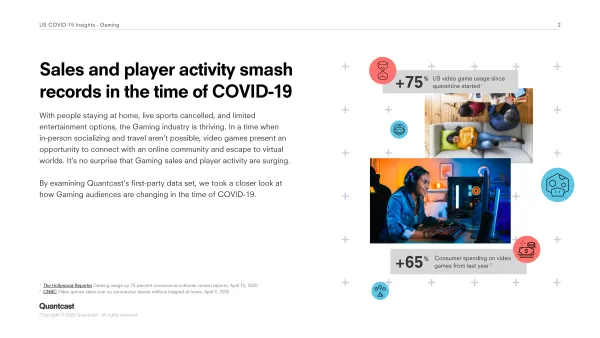
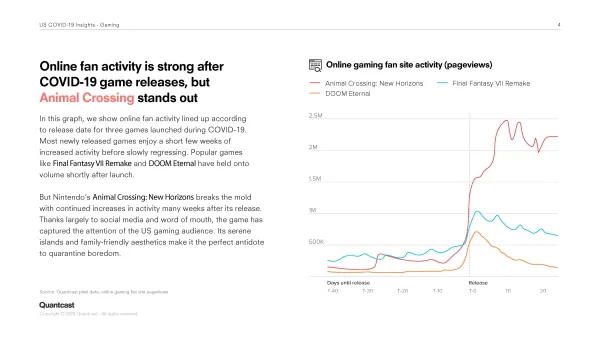
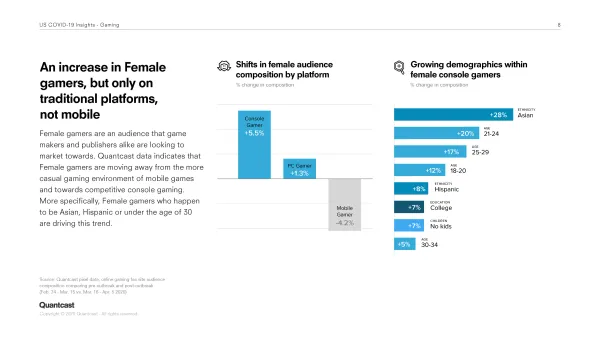
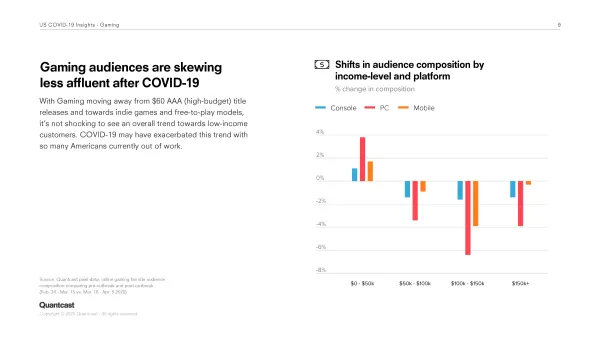
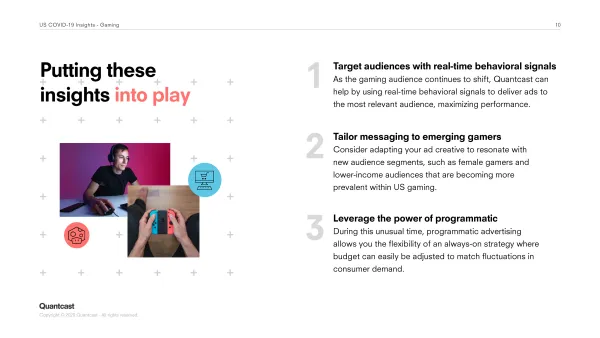
The gaming vertical report was one of the most extensive — covering audience composition, behavior patterns, and platform-level trends. Each spread had to support a different chart type while still reading as one document.


A standalone seasonal piece — donor behavior visualized as a single shareable infographic.